Big Data for Humanity
Some friends and I felt that what happened in Flint, Michigan could have been averted if people's homes, schools, and restaraunts were equipped to test water for lead and other contaminents. We set about designing and building a sensor system that can live in people's homes, test continuously, and send that data to the cloud. In effect, the entire infrastructure of drinking water in a municipality could be tracked, we calculate, with just a few installs.
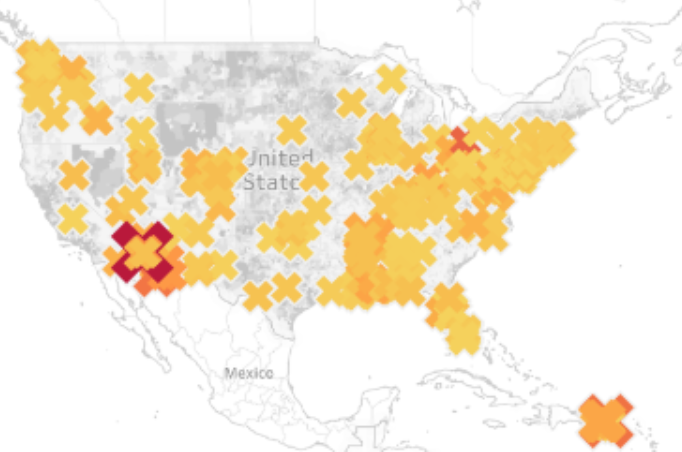
Map generated with Tableau, with waterstate.io data, depicting locations of skipped and failed water testing across the US between 2006-2016

Developing consumer hardware products, especially where the FDA might get involved, is nowhere as fast as making software. There is potentially years of testing and approval before a device like we have designed will reach the shelves of our hardware stores.
This is not quick enough. Nor do we have enough proof of the scale of demand to support investment. We thought about crowd-funding, and that may be a good strategy.
I suggested we look into what governments and municipalities report, and maybe we could build a strategy from that.
About the research approach

The Challenge
1. What we quickly learned is that Flint is not an isolated incident
2. A massive volume of data could be found online, but in a format that was not conduscive to searching
3. The data, found mainly in PDF's that municipalities uploaded, we not in consistent format, so standard OCR was not reliable
4. The units of measure varied by orders of magnitude from one place to another. Some used ppm only, others grams/cc, etc.
5. Testing was irregular, both across locations, and at many municipalities. There were claims of safety, but sometimes testing went unreported (presumably not performed) for an entire year or more.
The Design

1. We had to experiment with methods of reporting water safety in a way that appeared both objective and scientific, but also easy to interpret. We felt people could respond to a "water score", based on an 800 point scale.
A water source that met 2015 EPA standards on an annual basis would typically earn a score of 800 (avoiding, for now, user-taste measures).
We decided that a map would be an understandable, if complex, user interface that Google, Apple, etc. had already trained some people to use.
Any app, even a game, has only one opportunity to teach the user to interpret the UI/UX.

2. We also decided to leverage a very familiar paradigm to help people understand how to respond to the data the app presents about water quality
Safe
Caution
Unsafe

>700
500-699
<500
2. We included a history graph so users who wanted to look more deeply could see how tests were performing. We also needed to clearly illustrate when tests were skipped, which, it turns out, is far more common than we realized.
If the user feels like they failed somehow, it's the product team's job to understand why.
Constraints:
No Budget
No UI Designer on Staff
3. Finally, we took the constraints we had as a given. As a startup, our best competitive advantage would have to be our lean approach to selecting UX ideas we could implement quickly, and focus on our expertise in engineering, data science, public housing advocacy, and product strategy.
The result was in less that three months we had scraped half a million public records for water quality history and made it searchable.

A vast majority of app users I speak to confess to being frustrated and confused by apps they appear to have mastered.
3. Among the UI enhancements...
- "roll up zoom" displays a number for the reports accessible as the user zooms in.
- Recent news articles accessible with a single tap
- Iconography to indicate the type of information being presented
4. Finally, we also came up with a model we feel can generate another level of user engagement:
Location-Based Games
- Users can take missions "Survey Requests" to go to a place and document the water including lead tests, pH, sediment, odor and taste.
- Users can generate missions and upvote these for higher point value.
- An economy of points biases toward repeat testing and verification
The second version, Waterstate Spy, would send users on missions to scout both the known infrastructure, tagging water treatment, blocked or polluted storm drains, and industrial polluters, with a goal of mapping the total water supply and identifying potential dangers, for fun.
