Customer Research
People-Sized Technologies
To engage the South City community in the problems of climate, we had to first demonstrate our commitment to understanding who the community is and what it means to live there.
We had technology, apps, mobile maps, virtual and augmented reality in our proposal. But what we needed first was credibility.
Design in-and-out-of-the-Box
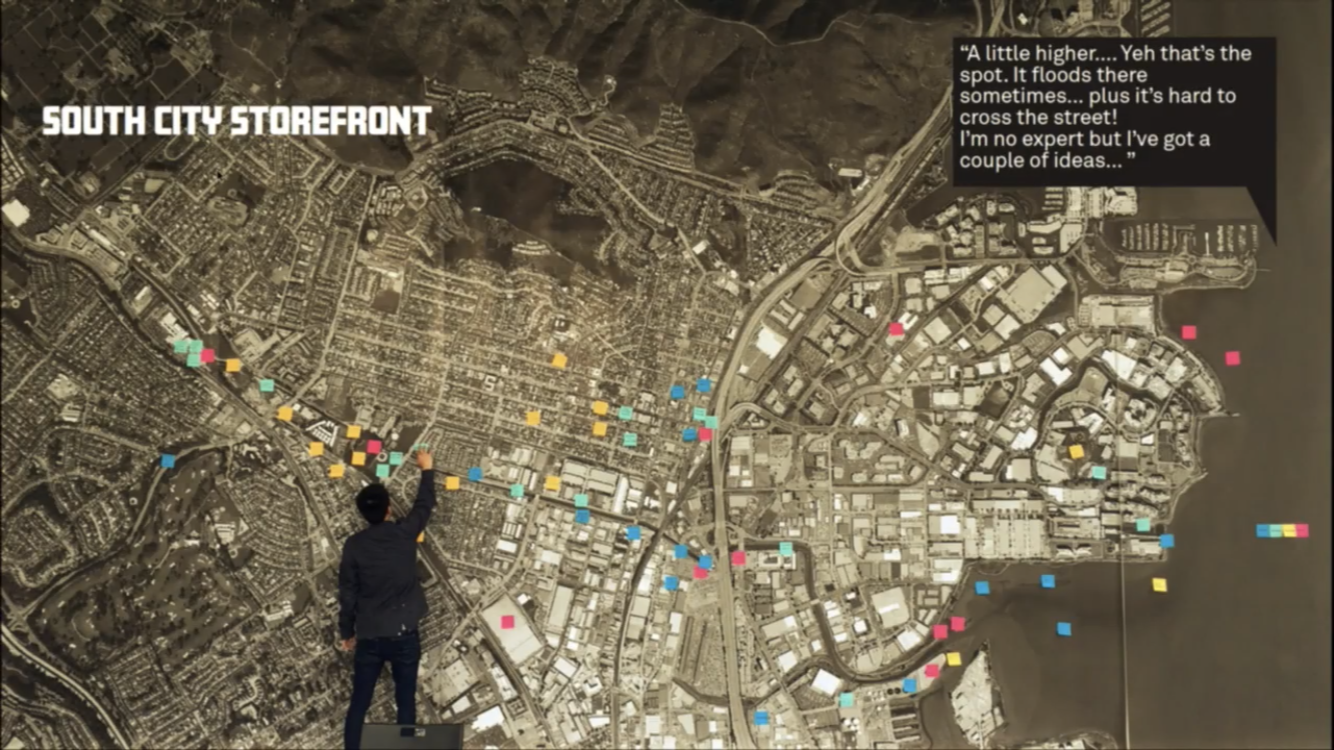
Hassell's architects and city planners had leased an empty historic bank building on the main drag of Grand avenue. To solve the problem of decor, the team purchased a massive print from a recent high-quality aerial photo.
It took only a few moment to see an opportunity to draw directly on my experience with game design. Using sticky notes on drawings was nothing new to city planners. Inviting locals to walk in and take the place of experts, however, felt new... and risky.
We were not disappointed.
Community Engagement
People-Sized Technologies
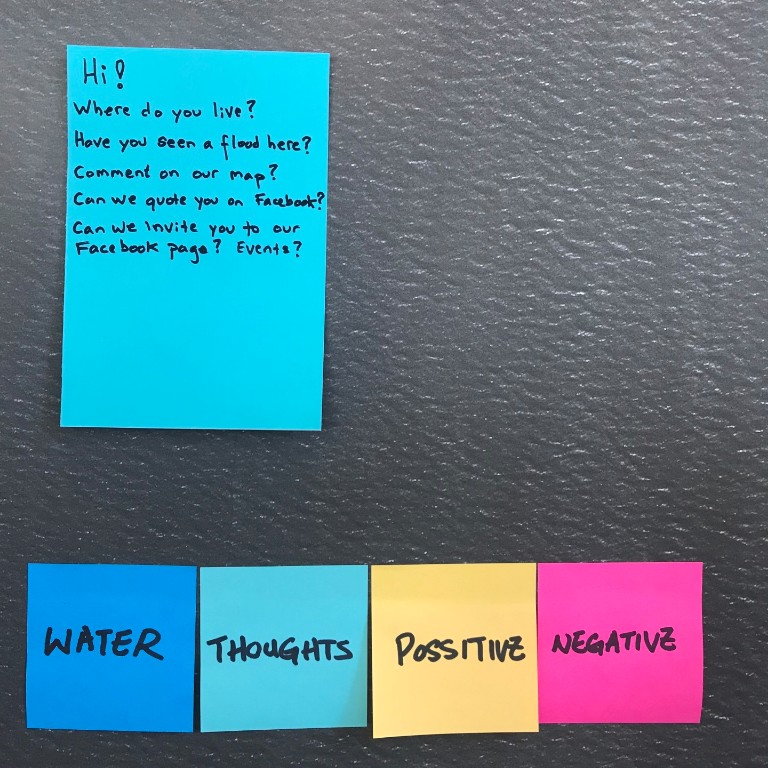
Sticky notes were color-coded, adding a dimension to the information collected, but also helping participants think about the kinds of observations they could make of their inherent knowledge, as South City residents.

Design in-and-out-of-the-Box
Our Data Strategy to Building Engagement:
- Prioritize lived experience over abstractions
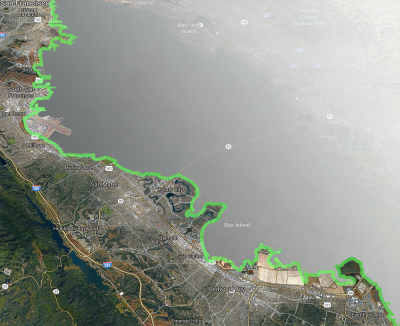
- Build on observations of the Oyster Point waterfront
- Encourage observations of Colma Creek
- Highlight both positive and negative experiences
Measure and Evolve
Fast Experiments
Rapid-Prototyping enabled us to generate a variety of tools. Some were simply to provide alternative experiences to support engagement. Others had a specific research purpose.

Key Performance Indicators
The KPI's set forth by the Board of Resilient by Design were:
- Demonstrate stakeholder support
- Leverage community expertise
- Deliver an engagement strategy that builds
awareness of climate change and its effects
awareness of climate change and its effects
A Backlog of Experiments
I responded by proposing we treat all our design assets, activities, and products as experiments in engagement.
Our customer segments:
- Family Residents
- Commuters
- Students
- Business Owners
- City and County Officials

Key Performance Indicator example:
Do at least 50% of local residents who complete a survey engage in another activity or visit the shop within a month?
Do at least 50% of local residents who complete a survey engage in another activity or visit the shop within a month?
In this example, we targeted a local group of High School seniors, organized by the Youth Leadership Institute. Our goals:
- Engage the kids in the work of research for the designers and engineers, in the place they lived.
- Gather sentiment scores around specific neighborhoods and features of the city
- Raise awareness of the key water features of Colma Creek and Oyster Point and their role in wastewater management

Key Performance Indicator example:
Do 25% of locals who view the locations depicted on the Facebook page comment and correctly identify what they see?
Do 25% of locals who view the locations depicted on the Facebook page comment and correctly identify what they see?
We aspired to create an AR/VR experience to reveal features of the local environment, past, future, or simply hidden from the untrained observer.
Lacking time to execute fully, I proposed we tap the Facebook 360 capability, and ask the team to use their own expertise to visualize a future flood situation.
Using hydrological models, photos of South City, and the artistic rendering capabilities at Hassell Studio, the team produced several visualizations of possible futures.
Visitor engagement increased by over 400% relative to other posts.
I combined Facebook's analytics capabilities with visualizations and analysis tools in Tableau to produce the final report on social media engagement efforts for the Resilient By Design Board of Directors, in June of 2018.
The facebook page and many of the experiments can be viewed at:
